
Posted 5 May 2008
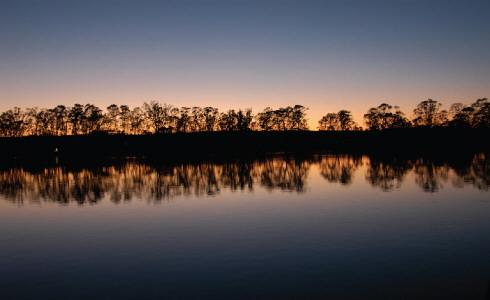
Sunrise on the Murray River at Mannum, South Australia. Greg Rinder, CSIRO.
How does the Murray-Darling's complex water system work, how do we measure its capacity and supply under increasing demands, and how do we understand the implications for local communities - in just a year? CSIRO's Murray-Darling Basin Sustainable Yields Project, probably the most ambitious resource inventory attempted anywhere in the world, has met that challenge. Graeme O'Neill reports on a historic and timely research undertaking.
The Murray-Darling Basin (MDB) is in the grip of one of the more severe droughts in the last century, adding climatic complication to a list of other severe pressures on the water system: overcommitment of its flows; salinity; the environmental effects of dams, weirs and locks; and invasions by pests like European carp.
Queensland, New South Wales, Victoria, South Australia and the ACT exploit the Basin's waters. Historically, each has competed for an equitable share of the system's resources - without being able to predict the likely effects of their policies and decisions on the system as a whole.
For the first time since Hamilton Hume and William Hovell discovered the Basin's major artery, the Murray River, in 1824, that capability now exists.
In November 2006, as the severity of the drought and its impacts on agriculture and urban water supplies became clear, former Prime Minister John Howard called the Premiers of the MDB states together to consider immediate measures to address the looming water supply challenges in the southern Basin.
The National Water Commission was instructed to engage CSIRO to take the first inventory of sustainable yields of all surface and groundwater systems within the Basin, against a background of climate change and other confounding factors: localised water storage in farm dams, plantation forestry and the effect of wildfires on catchments.
CSIRO's Murray-Darling Basin Sustainable Yields Project (MDBSY) has been the largest research contract the organisation has taken on in its 80-year history. It has generated a massive data set to drive a computer-based 'supermodel' of the Basin's water resources, created by linking 40 existing and new models of surface and groundwater flows and extractions within the Basin's 18 individual catchments.
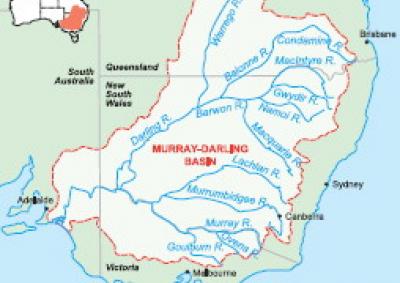
The million-square-kilometre Basin covers a seventh of the continent, and supplies at least 40 per cent of the nation's agricultural production. Its waters sustain two million people, not counting the 1.4 million people of the South Australian capital, Adelaide, which use its supply downstream.
Three well-known rivers meander through the Basin - the Murray, the Darling and the Murrumbidgee. Other major rivers rising on the western slopes of the Great Dividing Range deliver episodic flows that regenerate a vast system of permanent and ephemeral creeks, lakes, billabongs and marshes.
Even Solomon might have baulked at the challenge of dividing the Basin's waters equitably between four thirsty states and one territory, while maintaining sufficient flows to ensure the system's ecological health.
Its well-publicised regression attests to the limited impact of decades of well intentioned efforts by Commonwealth and state agencies to manage its water resources sustainably.
Those efforts have long been frustrated by an inadequate understanding of the system's capacity, its complex hydrological machinery, and the aggregate effects of drought, floods and the varying demands of each state and territory for its waters. A rapidly changing climate further complicates the picture.
Over the past decade, precipitation over the Basin's southern catchments has been significantly lower than the longterm average and global climate models are indicating that future rainfall will also be significantly lower than the historical average. What effects will changing water availability have on agriculture, horticulture, forestry, urban supplies and the environment? How can water management agencies plan for the effects of climate change on water availability?
A year ago, these questions were largely unanswerable.
The MDBSY Project's development of the first integrated hydrological model of the entire Basin means water management agencies can now assess the potential consequences of their management policies and decisions under dry, moderate or wet future climatic scenarios, at the level of each catchment, or across the entire Basin.
'We believe there has never been a water resource inventory at this scale anywhere in the world,' said Dr Tom Hatton, Director of the CSIRO-led Water for a Healthy Country Flagship, which is managing the project.
'Nobody has looked at surface and groundwater resources under past and future climate scenarios at this level of detail.
'First we compared the past 10 years to the long-term record (1895-2006). This enabled us to look at the recent experience of drought in its historical context,' Dr Hatton said.
'Then we took the scenarios presented in IPCC 4AR [the 2007 report of the Intergovernmental Panel on Climate Change], and modelled the likely effects of climate change on the availability of water at the scale of individual catchments within the Basin by 2030.
'The final scenario models the impact of future climate change, adding in developments that may affect the availability of water, like forestry, farm dams and increased groundwater extraction.'
"We believe there has never been a water resource inventory at this scale anywhere in the world."
This is the first attempt in the Basin to dynamically link groundwater balances with surface water availability.
'It calculates flows through and between the system's rivers, and groundwater-surface water interactions under current water-sharing arrangements, before estimating the water available under each scenario,' Dr Hatton said.
'Our involvement ends there. The issue of who should get how much water is a political decision.'
He said that, given its scale, complexity and 12-month timetable, the project had been a 'monumental' undertaking.
'We've brought in people from the best organisations around Australia - from Commonwealth and state agencies, and leading hydrological consulting companies. It's been a real Team Australia approach,' he said.
'We have implemented an unprecedented level of quality control and assurance that allows us to trace the pedigree of all the primary data, for every one of millions of results.'
The project has rigorous processes for internal and external review, the latter via a panel of independent experts who report through a steering committee.
Dr Hatton said the government would establish a new Murray-Darling Basin Authority under the Commonwealth Water Act that would set a new sustainable diversion limit for the Basin's water resources. The model would be crucial to quantifying these resources, and identifying stresses and strains within the system.
Project Manager Dr Bill Young has led a team of over 100 technical staff from over a dozen organisations and managed internal and external review processes in order to deliver robust assessments of water availability across the MDB. The 18 individual catchment reports incorporate a fact sheet, a thematic summary of the findings describing runoff, river flows and groundwater recharge, and a detailed technical report.
A final report, due for release in early 2008, will encapsulate all the information across the 18 catchments to give a water yield assessment for the entire Basin. By the end of 2007 seven reports had been issued, for the Wimmera region in western Victoria, the Eastern Mt Lofty Ranges in South Australia, the Warrego and Paroo regions, both predominantly in south-western Queensland, the Namoi and Gwydir regions in northern New South Wales, and the Border Rivers region of southern Queensland and north-eastern NSW. The roll-out of regional reports has continued in January and February 2008.
Dr Young said the first phase of the project involved agreeing on the climate scenarios, and defining the regions and catchments to be modelled. Dr Francis Chiew then applied outputs from 15 IPCC global climate models to each catchment to model the effects on runoff.
Each climate scenario models runoff at a resolution of 5 km by 5 km using daily rainfall and potential evapotranspiration data. This then allows the impact that climate change and catchment development has on runoff to be estimated for each region.
'People have done this in bits and pieces before, using different hydrological models and different climate change projections, with mixed results,' Dr Chiew said. 'For the first time, we have produced a picture of runoff in the Basin during historic, recent and possible future climate changes, using a consistent, robust and well-documented approach.'
Contributions from each state
Dr Geoff Podger coordinated the modification of around 70 different river models, many developed by Queensland, New South Wales, Victoria and South Australia, for integration into a dynamic model of the entire Murray-Darling Basin.
The Queensland Department of Natural Resources and Water (DNRW) contributed models for the Paroo, Warrego, Nebine, upper Condamine, mid-Condamine, St George, Lower Balonne and Moonie rivers.
Queensland DNRW and the NSW Department of Water and Energy (DWE) jointly contributed models for the Border Rivers. DWE also supplied other models, including for the Gwydir, Namoi, Macquarie, Darling, Lachlan and lower Murrumbidgee rivers. A new model was developed for the upper Murrumbidgee and its inflows into Lake Burrinjuck (linking it to the ACT water supply model).
Snowy Hydro provided its Blowering, Burrinjuck and Hume dam inflow models.
Victoria's Department of Sustainability and the Environment made available its models of the Ovens, Goulburn-Broken, Campaspe, Loddon, Avoca and Wimmera rivers, while South Australia's Department of Water, Land and Biodiversity Conservation provided models of the Eastern Mt Lofty Ranges.
The Murray-Darling Basin Commission provided its models for the Murray system.
Dr Geoff Podger supervised modifications to around 70 river models to standardise their time steps and spatial units, as a prelude to linking them in a single 'supermodel'. The outputs are presented as summaries of water availability encapsulating the impact of potential climate change on water users in each catchment in the Basin. Dr Podger worked closely with Dr Glen Walker, who quantified exchanges between surface water and groundwater.
Dr Walker supervised the groundwater segment of the project, developing recharge models with data from climate models to estimate rainfall recharge to groundwater aquifers.
In some cases, this just involved passing information from one part of the model to another, but for others, software to link the models had to be developed (see page 11). His team linked the surface and groundwater models to calculate river flows, and converted the flows to river heights to estimate groundwater inputs during flooding.
Groundwater reserves were represented as pressure heads and then translated into subsurface flows. Rivers cut through many of the major groundwater systems so exchanges between them occur at a rate that varies with the local geology and the porosity of the water-bearing geological layers, and the level of the river in relation to aquifer pressure. For example, withdrawing 20 gigalitres from an aquifer could, depending on the 'connectivity' level through geological layers, result in a 10 gigalitre recharge from the river, reducing its flow correspondingly.
The model runs calculated the net result of flooding or aridity on river and groundwater reserves. The model also represented feedback loops between the surface water models - for example, water levels in the Menindee Lakes constrain flows into the Darling River.
Other feedback loops represented inter-valley transfers between the Snowy, Murrumbidgee and Murray rivers, Lake Victoria in far western NSW, and the effect of delivering secure water allocations from these rivers.
Finally, the linked model was run under multiple climate scenarios: the historical record, the past 10 years, a range (dry, medium and wet) of possible climates by 2030, factoring in the influences of forestry, farm dam and groundwater extraction - in all, over 600 permutations for the whole Basin.
Dr Geoff Podger, who oversaw this work, said, 'Modelling each scenario requires a huge number of iterations and produces billions of items of data.'
'Our database allows us to make all sorts of inquiries and comparisons across the system, through a schematic interface that allows us to point to any node and get local information for that catchment.'
CSIRO was also asked to model the Basin as it existed before its dams, weirs and locks were built, and before extractions began, as a benchmark to assess the effects of development.
'In some catchments, the changes we saw from the pre-development phase to the present far outweigh any impact we might see under any of the climate change scenarios,' Dr Podger said.
'But, in contrast, for some others it's under one per cent, and climate change will be the major influence on flows in the future.
'What will be most interesting in the final figure for the Murray is the cumulative effect of changes in tributaries that would have contributed a large proportion of its pre-development flows. It's likely to be big.'
Scott Keyworth is managing delivery of the project's results to the states and their water management agencies.
'They have a major interest in the potential impacts on each catchment and the entire Basin, and they need to access the data, and understand the methodology so they can apply it to their own region,' he said.
'We have engaged the states as active partners, rather than as groups that felt obligated to provide information.
'The MDB has a highly variable climate and some of the most variable stream flows in the world.'
Keyworth believes modelling of the entire system will highlight the consequences of past management decisions as well as stark choices to be faced in the future.
'One of the amazing outcomes of this work is that, for the first time, we can observe the dynamic interactions between surface and groundwater reserves for every part of the Basin,' he said.
'We're now in a position to model something like the Condamine-Balonne system in Queensland on the basis of a likely climate, and see what happens under the current management system.
'We can then go across the border, and use the output to drive the next catchment model, and track the impacts all the way down through the Darling River, to predict the effect on flows in the Murray and at the
Murray Mouth.
'We've linked the model to Google Earth, so we can look at the surface topography and characteristics of each catchment. If there's a big storm in the headwaters of the Darling River we can determine the distribution of surface flows in local streams, and flows into other river systems.
'A major flood in the northern part of the Darling's catchment might take weeks to reach the Murray.
'We can calibrate impacts at different points down the river, estimate what volumes will arrive, and model the effect of diverting some of the excess into the Menindee Lakes and Lake Victoria.
'We also have the capacity to model tradeoffs: how do we balance the system?' he said. 'Do we try to capture the water as it moves through, or allow it to continue unimpeded, and what environmental impacts would each option have?'
Keyworth believes the audacious project has laid the foundation for an enduring partnership, and further cooperation between the Commonwealth and the states to better manage the water resources of the Murray-Darling Basin as a system.
Reproduced from ECOS 141 Feb-Mar 2008, www.publish.csiro.au/ecos.
Links:
Groundwater level monitoring data recovered at the end of 2019 from Mystery Road at Breeza on the Liverpool Plains reveals a direct connection between the Gunnedah Formation unconsolidated sands and gravels and the underlying Permian coal measures. The connection is provided by the old deep channel of the Mooki River that cuts down into the coal measures. This is a crucial piece of evidence to be incorporated into groundwater models.

What are the effects of fire on water underground? Let’s think about what happens on the surface, and translate that to what is likely to happen to the subsurface.

The effects of tidal forces on groundwater might be less apparent to us than their effects on the ocean, but they’re just as important.

Dr Oliver Knox has brought together information from some of the industry’s researchers conducting work oncotton-producing soils.

Groundwater research at ANSTO has provided crucial information to support the management of finite groundwater resources appropriately and sustainably—answering questions about groundwater recharge, groundwater age and dynamics, the interaction between surface water and groundwater and salinisation.

Professor Andy Baker features in American Water Resources Association ‘Water Resources Impact’, September 2020 edition.
CWI’s network of researchers is widening - Welcome Taylor Coyne!